I've just published a new open-source project: BloodHound-Legacy, a fork of BloodHound Legacy 4.3.1 that can display and work with data collected for BloodHound Community Edition. ADCS objects, local groups, the newer attack-path edges, CE's Tier Zero tagging - all of it now shows up properly in the old Legacy interface.
That probably sounds backwards. SpecterOps deprecated Legacy in 2023, CE is the supported product, and in BloodHound for Defenders I told you to start with CE. I still would. But there's one job where Legacy is simply better, and I kept running into it.
Why Fork a Deprecated Tool?
When I review a large environment, the CE graph gets hard to read. On a dense domain the layout sprawls off the screen and the nodes shrink until you can't make sense of them. Getting an overall picture of the attack surface - the thing you actually need at the start of an engagement - becomes a struggle.
The Same Domain, Two Views
Here's the same domain drawn by both tools. It's a fairly small environment - about 2,000 objects. Many of the environments I work in have 50,000 or more.
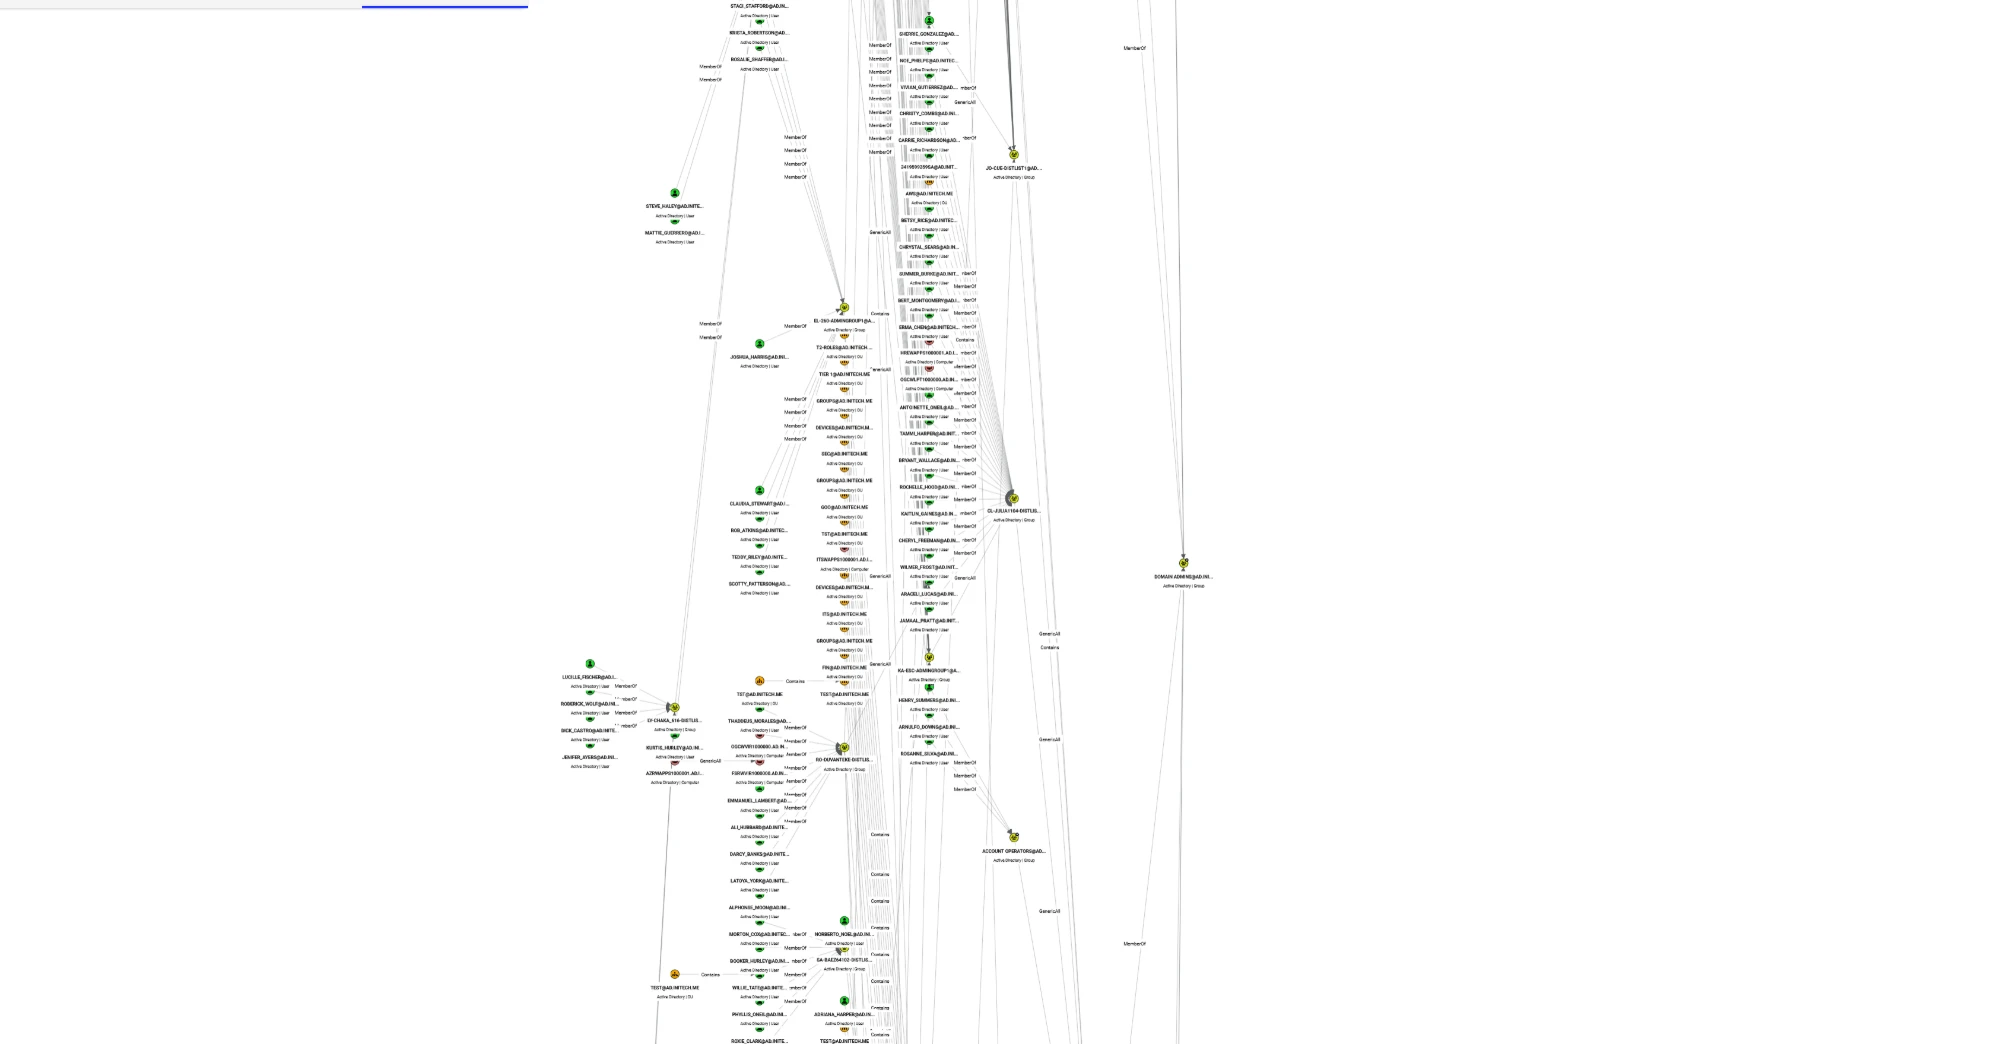
In CE, the result doesn't fit. It stretches into a long column that runs off the screen, and zooming out far enough to see all of it shrinks every node to a dot. You end up scrolling around one slice of the graph, trying to hold the rest of it in your head. At 50,000 objects, you lose the picture entirely.
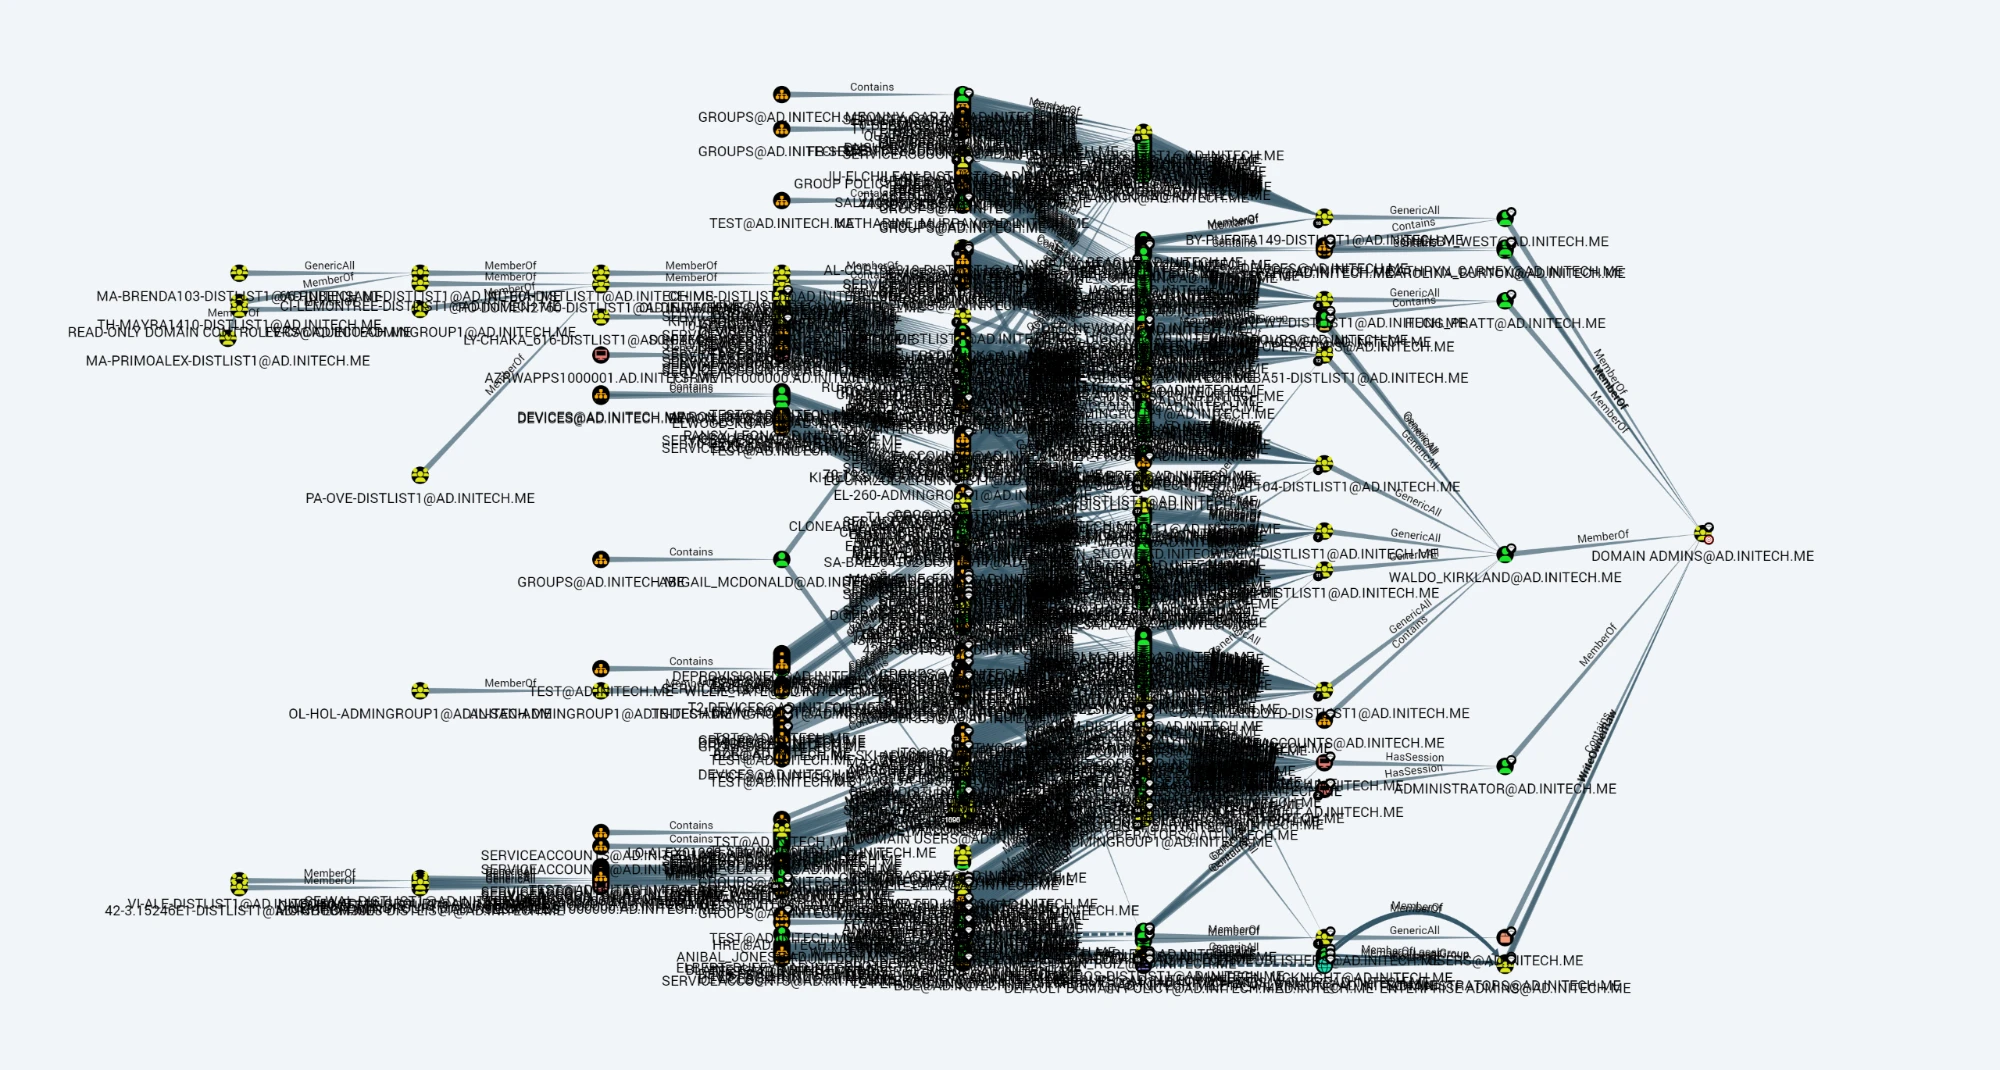
In Legacy, the whole graph is on one screen. The middle is dense - with Force Labels On, every label is drawn - but the shape reads at a glance: the OUs and groups on the left, the handful of groups and users everything funnels through, and Domain Admins on the right. That shows me where the chokepoints are and where to zoom in next, which is exactly the overview I need before digging into individual paths.
Legacy handles the same data far better. It keeps the whole graph on one screen with its structure visible, and it stays usable when a graph has a lot in it. So in practice I use the two tools for different jobs:
- Legacy for viewing and reasoning about a big graph - the big-picture review.
- CE for detailed, honed-in work on a specific path.
The problem is that Legacy predates CE's collection. Point it at a CE database and a lot goes missing: ADCS objects render as blank question marks, local groups and the newer edges have no icons, almost nothing gets a high-value diamond, and right-clicking a CE edge for Help opens an empty box. You end up looking at a nicer layout of an incomplete picture.
This fork closes that gap. The stock prebuilt queries are unchanged - it just teaches Legacy to understand everything CE knows about.
What's New
CE Node Icons
Every CE node kind gets CE's own icon and colour, including the ADCS kinds that Legacy drew as question marks: EnterpriseCA, RootCA, AIACA, NTAuthStore, CertTemplate and IssuancePolicy. ADLocalGroup, ADLocalUser and AZFederatedIdentityCredential are covered too, and low detail mode uses the same colours.
Edge Filtering That Applies Everywhere
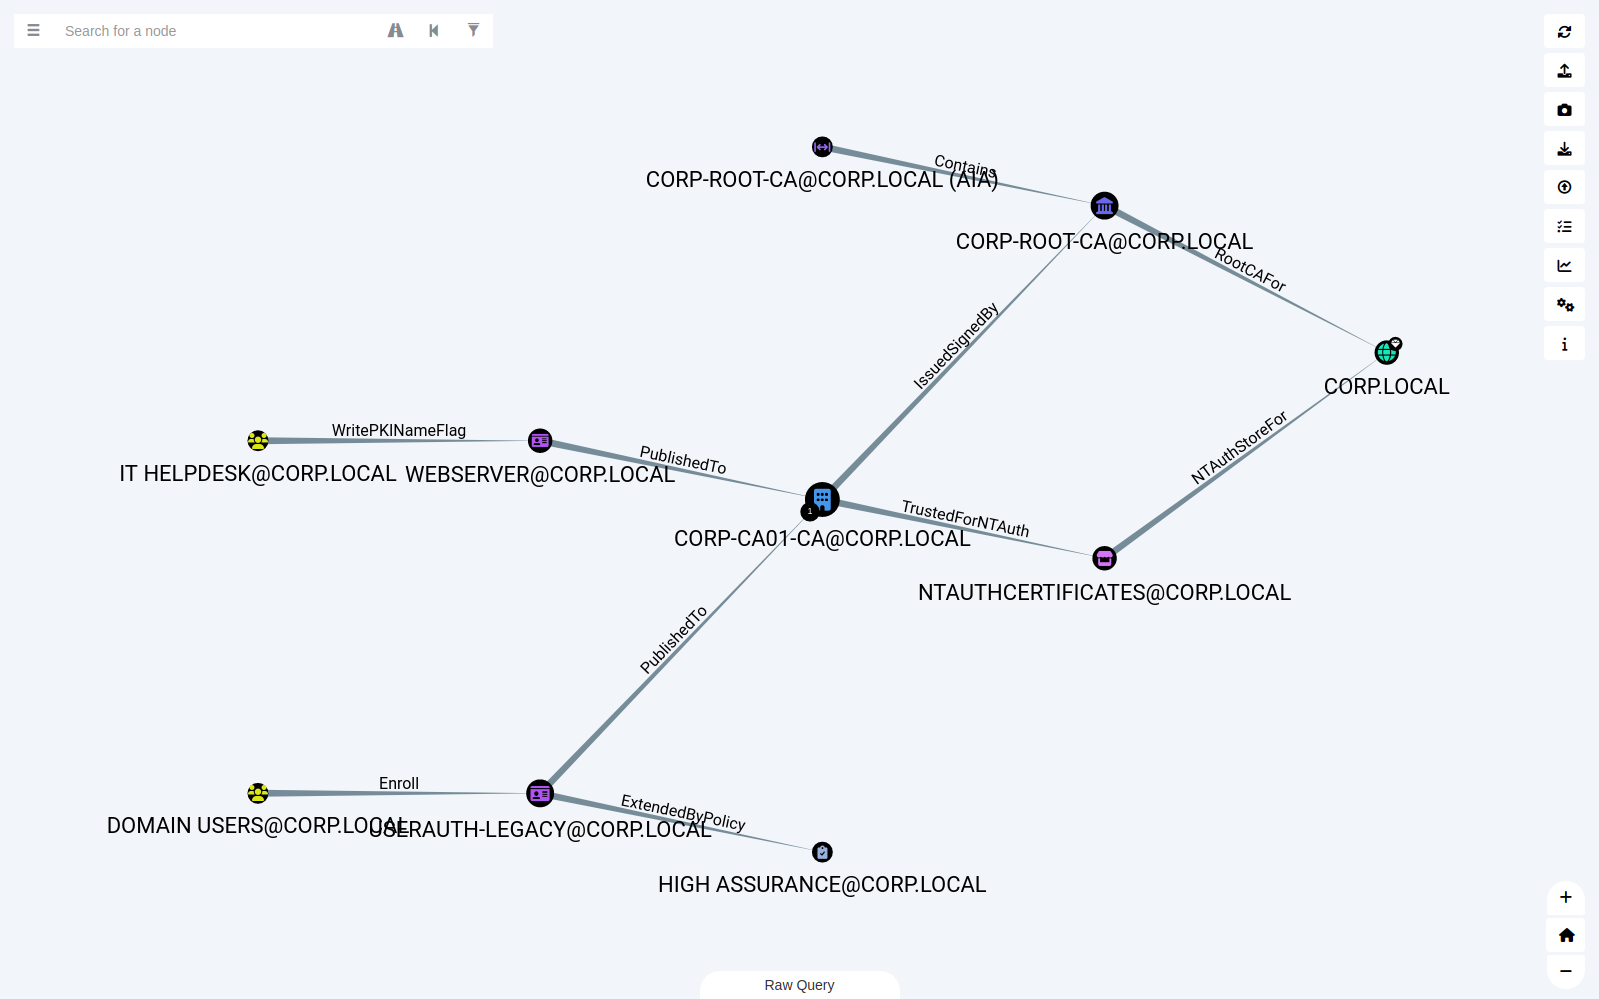
Stock Legacy only applies the edge filter to the handful of queries that use the {} placeholder. That's always bothered me. In the fork:
- New filter sections for ADCS (ESC1 through ESC13, GoldenCert), ADCS Control, Local Groups and CE Attack Paths.
- An "Other" section that picks up any edge type found in a drawn graph that doesn't have a row yet, so every edge can be filtered.
- Apply filter to every query - unchecked edges drop out of prebuilt, custom and raw queries, and out of the Node Info counts. Queries that write to the database are never modified.
- Recalculate reruns the current query with the current filter.
ADCS Attack-Path Composition
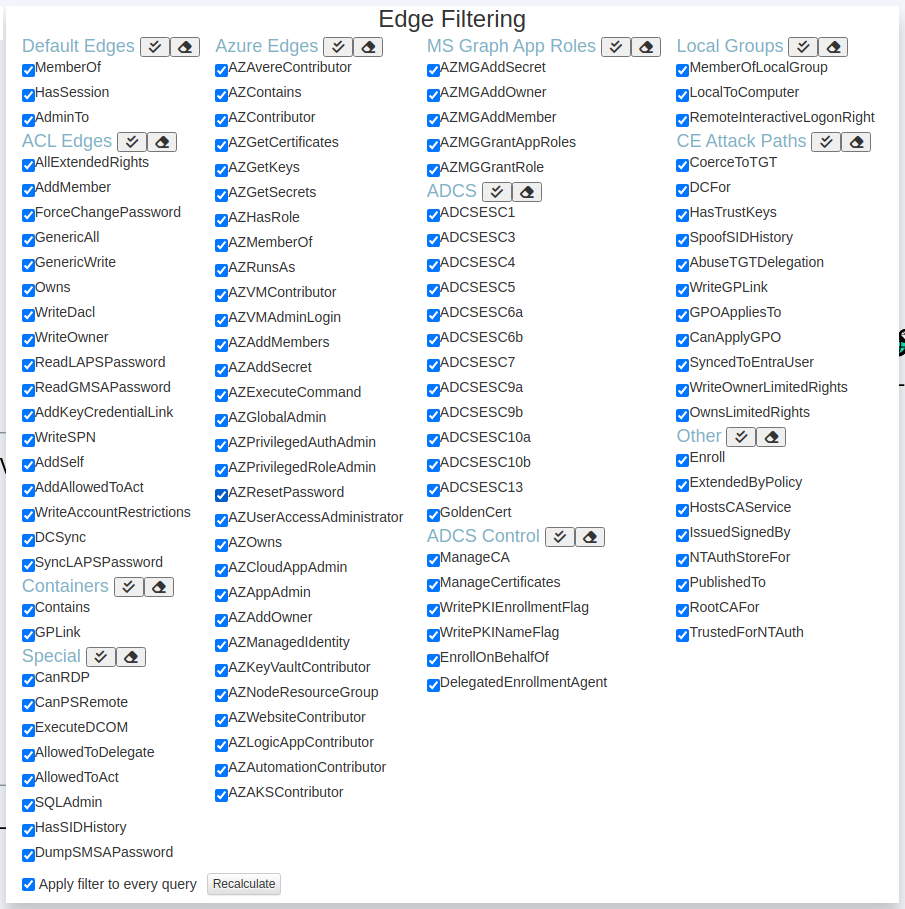
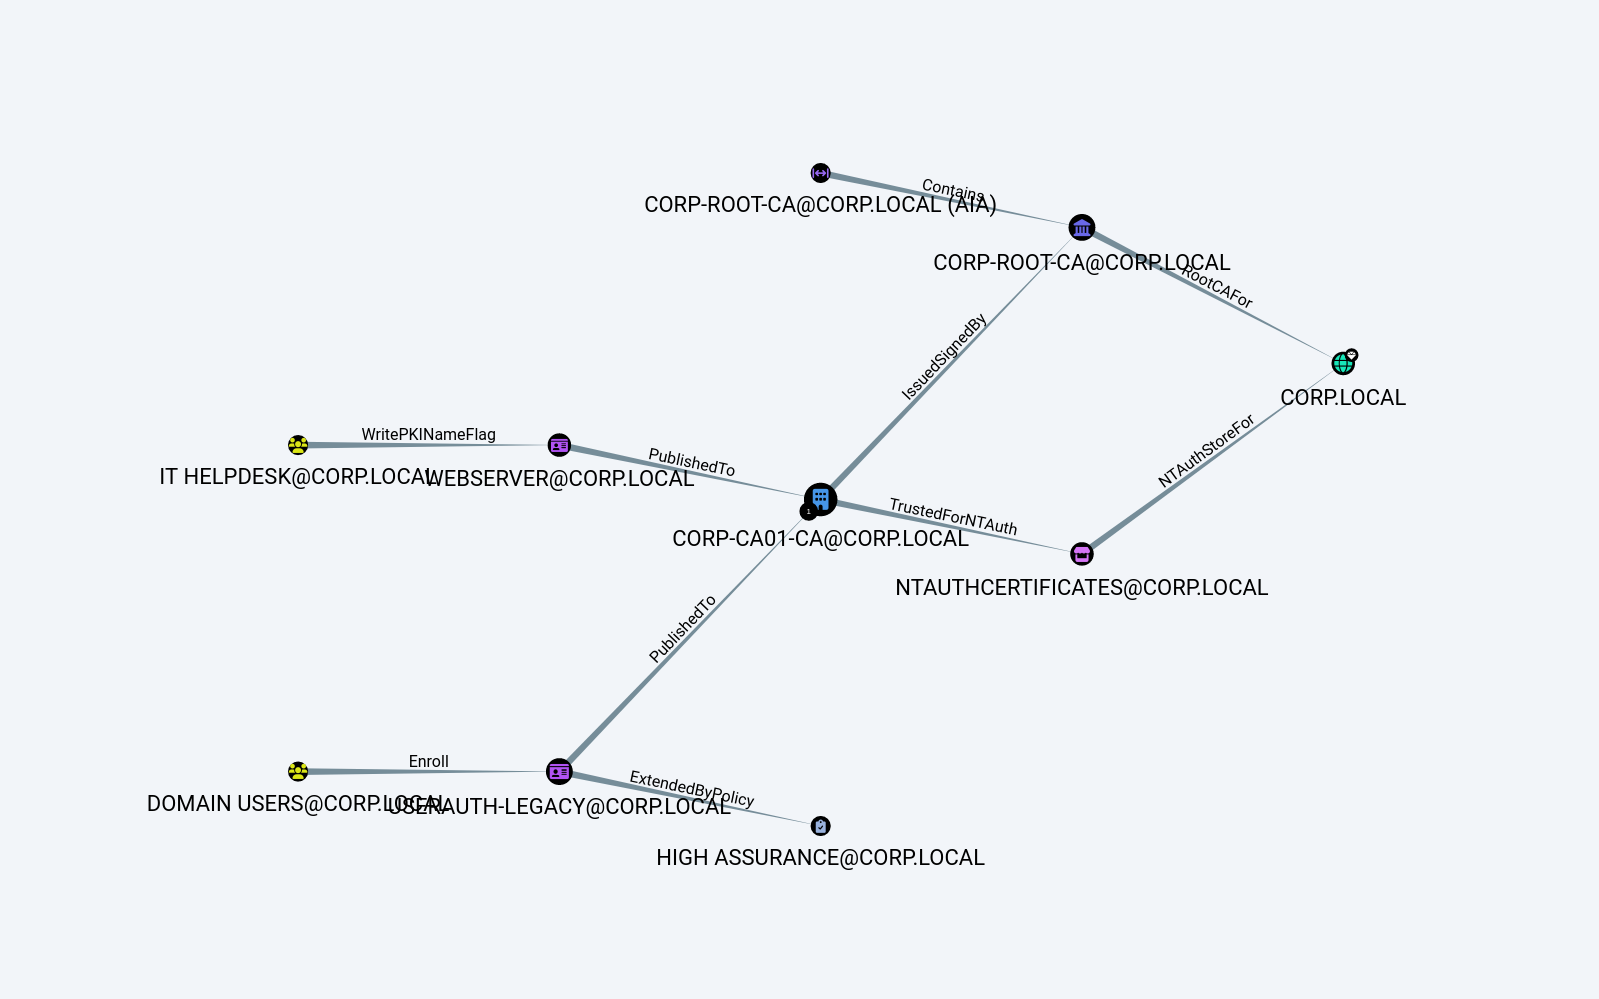
Like CE, an ADCS attack edge can now be expanded into the chain it summarises. Right-click an ADCS edge (ESC1, ESC3, ESC4, ESC6a/b, ESC9a/b, ESC10a/b, ESC13 or GoldenCert) and choose Expand ADCS Composition.
A single ADCSESC1 edge from Domain Users to the domain tells you there's a problem. Expanded, it tells you why: the enrollment right, the template's publication to the enterprise CA, the CA's chain up to the domain's root CA, and the CA's NTAuth trust. That's the chain you need to break, and the one you need to explain to whoever owns PKI.
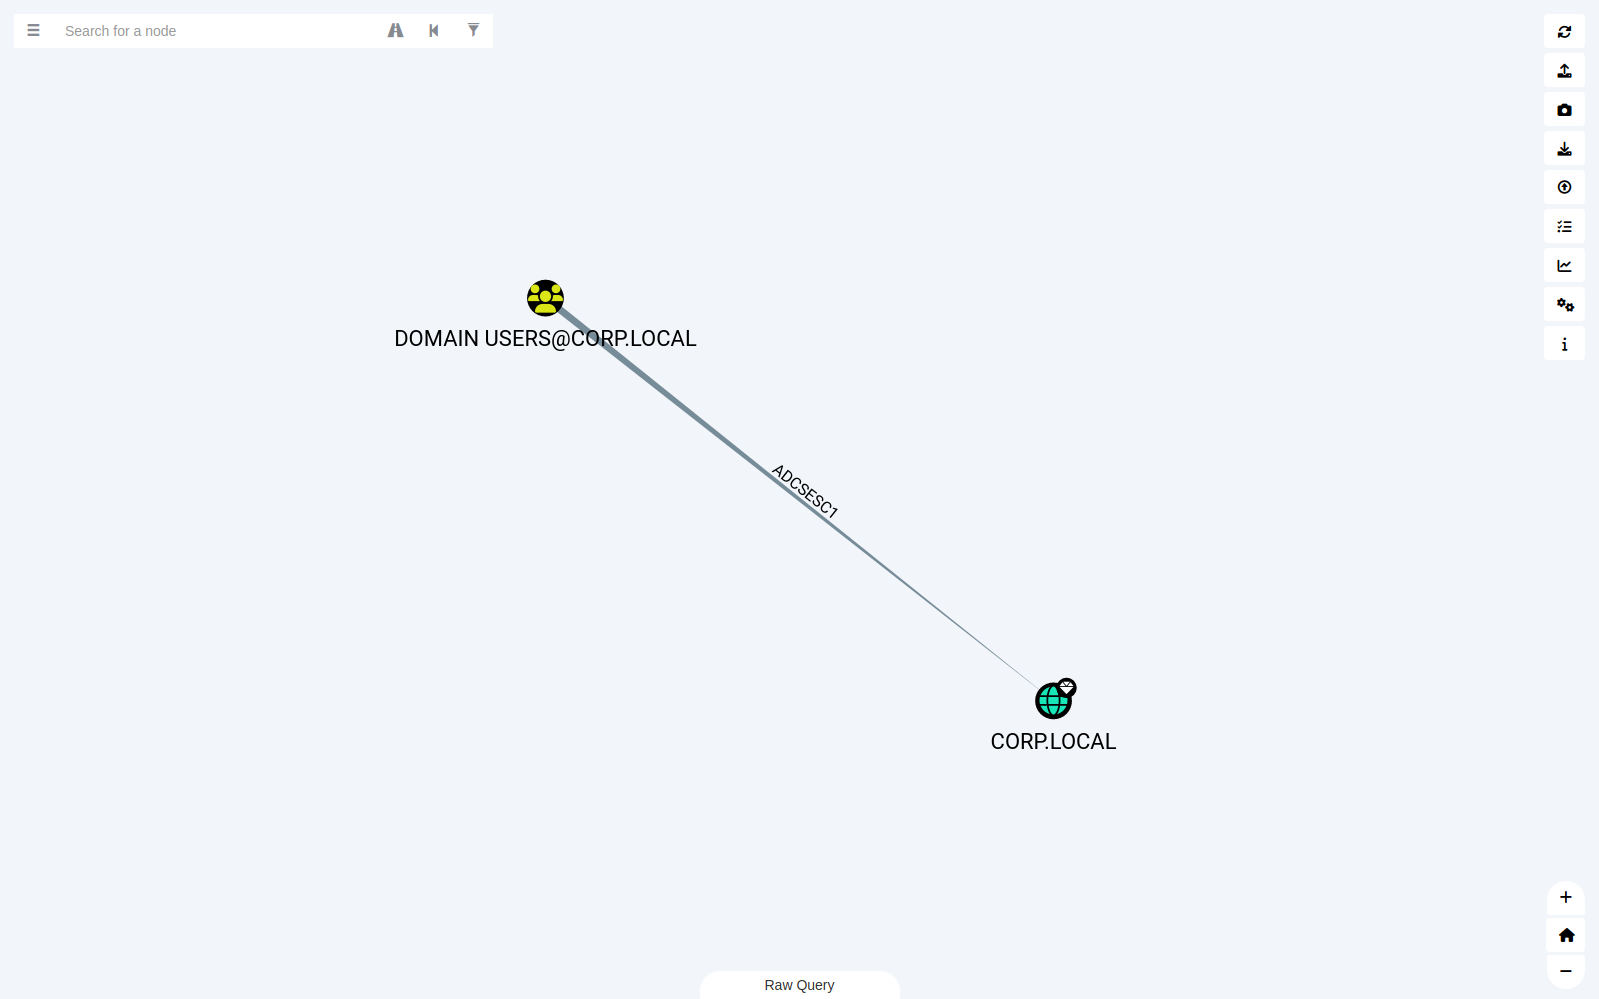
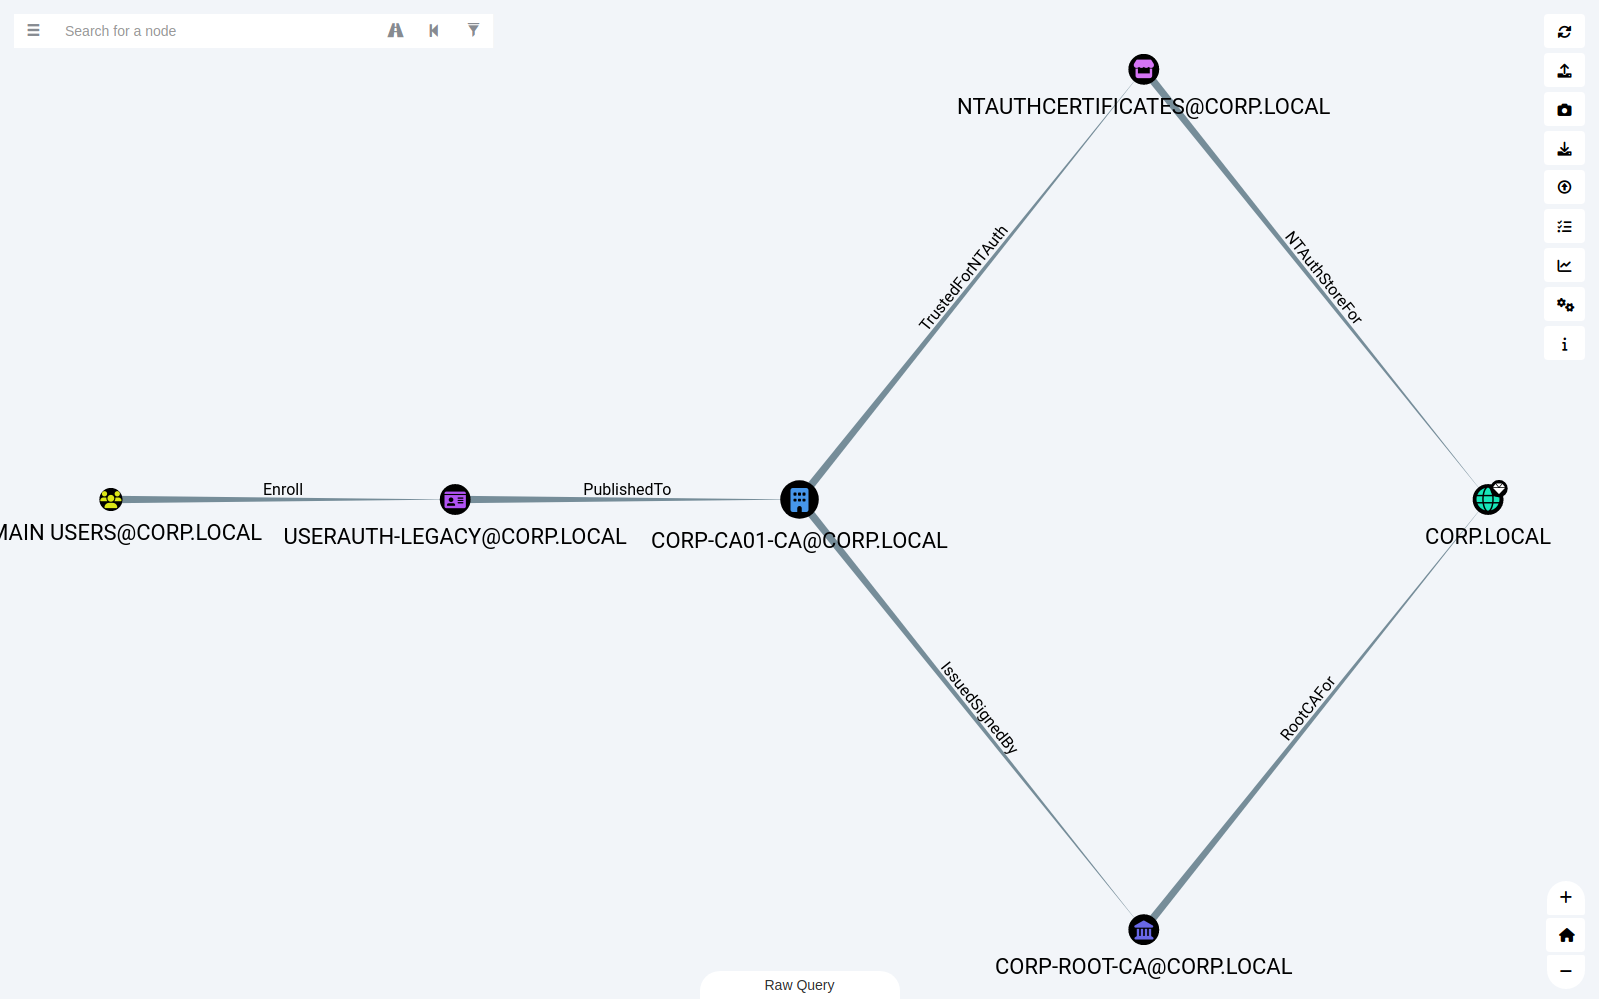
Right-click a domain and choose Expand ADCS Attack Paths to draw every ADCS attack targeting it at once.
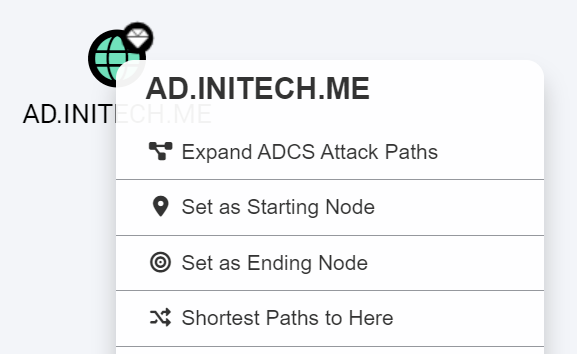
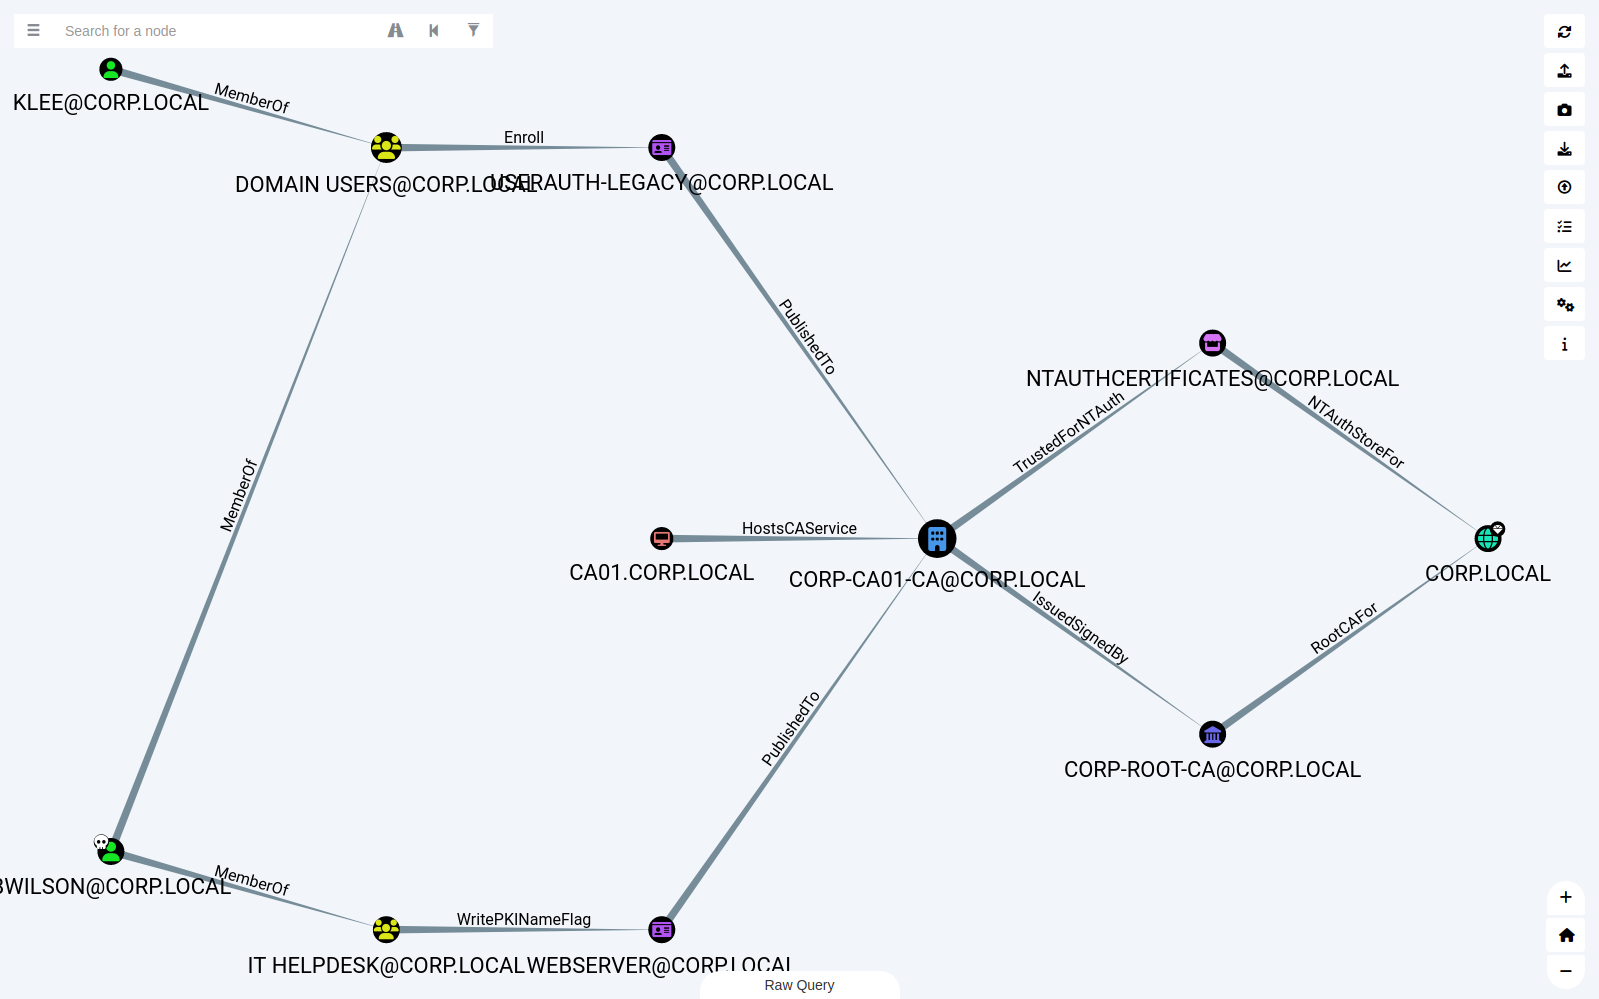
Note: These mirror CE's published composition queries and rely on CE-collected ADCS nodes and edges. With no ADCS data present they return nothing - same as in CE.
High-Value Markers That Understand Tier Zero
CE marks Tier Zero with the Tag_Tier_Zero label and admin_tier_0 in system_tags rather than Legacy's highvalue property, so a CE database used to show almost no diamonds. Now a node gets one if any of these is true:
- It has
highvalue: true(Legacy's own marking) - It has the
Tag_Tier_Zerolabel - Its
system_tagscontainadmin_tier_0 - It's a protected object, with Protected Groups Are High Value enabled - the AD protected groups and their nested members,
ProtectAdminGroupstargets, Azure tenants, and Global Administrator / Privileged Role Administrator holders
This is display only - nothing is written to the database. If you've read my post on AdminSDHolder and protected groups, you'll know why I wanted those nested members lit up by default.
CE Properties and Edge Help
Every Node Info panel now has a CE Properties section with readable names, one-per-line lists and formatted dates - including properties like isaclprotected and doesanyinheritedacegrantownerrights that stock Legacy only showed as raw keys. Node kinds Legacy had no panel for (CertTemplate, EnterpriseCA and friends) used to leave the previous node on screen; they now open properly.
Every CE edge also gets an Info tab explaining what it represents and a Refs tab linking to the official BloodHound documentation - ADCS attack and control edges, local group edges, and newer ones like CoerceToTGT, HasTrustKeys, WriteGPLink and SyncedToEntraUser.
Labels and Graph Image Export
Two quality-of-life changes that matter when you're writing reports:
- Force Labels On keeps node and edge labels visible at every zoom level, with configurable label sizes.
- A camera button saves the graph exactly as framed on screen, with configurable size, padding and markers. Numbered Auto-Save drops images straight into a folder as
00001.png,00002.png, and so on - no save dialog every time.
Building It
The upstream dependencies pin Electron 11 and webpack 4, so you'll need Node 16:
On Node 17 or later, set NODE_OPTIONS=--openssl-legacy-provider so webpack 4 can build. Settings and custom queries live in the app's user data folder, so replacing an existing Legacy install keeps them.
Use it alongside CE, not instead of it. Legacy itself is deprecated and unmaintained upstream. This fork is a viewing and analysis companion for CE-collected data - keep collecting with current SharpHound/AzureHound and keep CE in your workflow for path-level work.
Try It and Tell Me What Breaks
The project is GPLv3, like upstream. If you run it against your own CE data and something renders wrong, an edge is missing from the filter, or you want another composition query, open an issue on GitHub or get in touch.